Historical Stock Prices
NYSENASDAQView historical daily open, high, low, and close prices for any US stock.
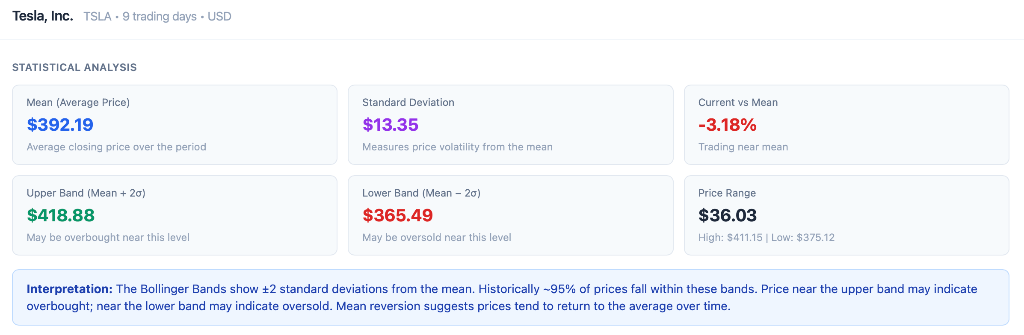
Click to enlarge
Why Statistical Analysis Matters in Trading
- Mean (Average Price) — Identifies where a stock "should" trade. Price consistently above mean may signal overbought conditions; below may signal value opportunity.
- Standard Deviation — Quantifies volatility. Higher std dev = wider price swings = higher option premiums, making it a core input for options pricing and strategy selection.
- Bollinger Bands (±2σ) — ~95% of prices fall within these bands. Stocks near the upper band may be overbought; near the lower band may be oversold — ideal for timing entries on cash-secured puts or covered calls.
- Mean Reversion — Prices tend to return to their average over time. Traders use this to sell options when a stock is extended, collecting premium while waiting for the reversion.
Search Stock Data
Financial Disclaimer
The information provided is for informational and educational purposes only and does not constitute financial advice, investment advice, or a recommendation to buy or sell any securities. All data is for illustrative purposes and should not be relied upon for investment decisions. Consult a qualified financial professional before making any financial decisions.