Technical Indicators
A technical indicator is a mathematical calculation based on an asset's historical price, volume, or open interest. Traders use these visual tools to identify market trends, momentum, and potential entry or exit points.
Why Traders Use Technical Indicators
Markets are driven by human psychology — fear and greed cause predictable, repeating price patterns. Technical indicators help traders cut through the noise by quantifying these patterns. Rather than asking "Is this company profitable?", technical analysts ask "What is the price telling me right now?"
Spot whether a market is in an uptrend, downtrend, or trading sideways before placing a trade.
Determine whether buyers or sellers are in control and how strongly a move is developing.
Find precise points to enter a trade for better risk-to-reward ratios and exit before reversals.
Main Categories
Click any category to expand its details, examples, and an illustrative chart.
Trend indicators smooth out price data to reveal the underlying direction of a market — whether it is moving up, down, or sideways. They are best used in trending (not ranging) markets.
Key Examples
- Simple Moving Average (SMA)
The arithmetic mean of closing prices over a set period (e.g., 50-day or 200-day SMA). A price crossing above the SMA signals potential bullish momentum.
- Exponential Moving Average (EMA)
Weighted moving average that reacts faster to recent prices. Traders watch the 9/21-day EMA crossovers for short-term signals.
- Parabolic SAR
Plots dots above or below price to show potential reversals and the direction of the current trend.
- Ichimoku Cloud
A multi-line indicator that identifies support/resistance, trend direction, and momentum all in one view.
Illustration
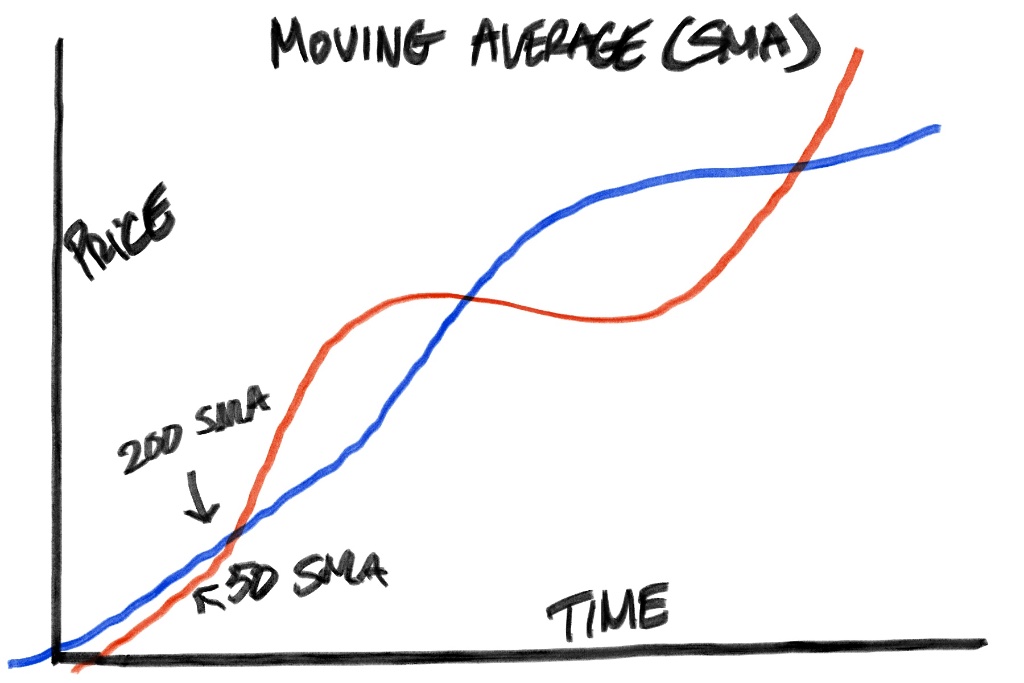
© Brian Sov. All rights reserved.
Momentum indicators measure the speed and strength of a price move. They help traders spot overbought or oversold conditions and anticipate potential reversals before they happen.
Key Examples
- Relative Strength Index (RSI)
Oscillates 0–100. Readings above 70 suggest overbought; below 30 suggest oversold. Widely used on 14-period settings.
- Stochastic Oscillator
Compares a closing price to its price range over a period. Values over 80 are overbought, under 20 are oversold.
- Rate of Change (ROC)
Measures percentage change in price over a specific number of periods, revealing acceleration or deceleration.
- Commodity Channel Index (CCI)
Identifies cyclical turns by comparing current price to its average price over a given period.
Illustration
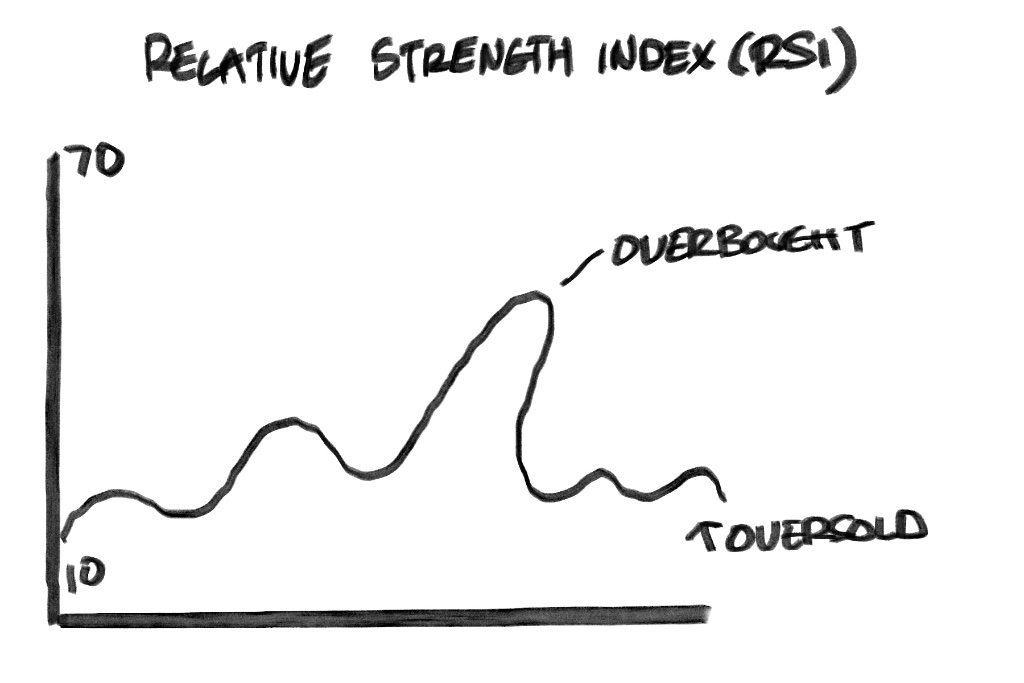
© Brian Sov. All rights reserved.
The Moving Average Convergence Divergence (MACD) bridges trend-following and momentum by measuring the relationship between two EMAs. It is one of the most widely used indicators across all asset classes.
Key Examples
- MACD Line
Calculated as the 12-day EMA minus the 26-day EMA. When positive, short-term momentum is above long-term.
- Signal Line
A 9-day EMA of the MACD line. A MACD crossover above the signal line is a bullish signal.
- MACD Histogram
Shows the difference between the MACD line and signal line. Expanding bars indicate growing momentum.
- Divergence
When price makes a new high but MACD doesn't, it signals weakening momentum — a potential reversal warning.
Illustration
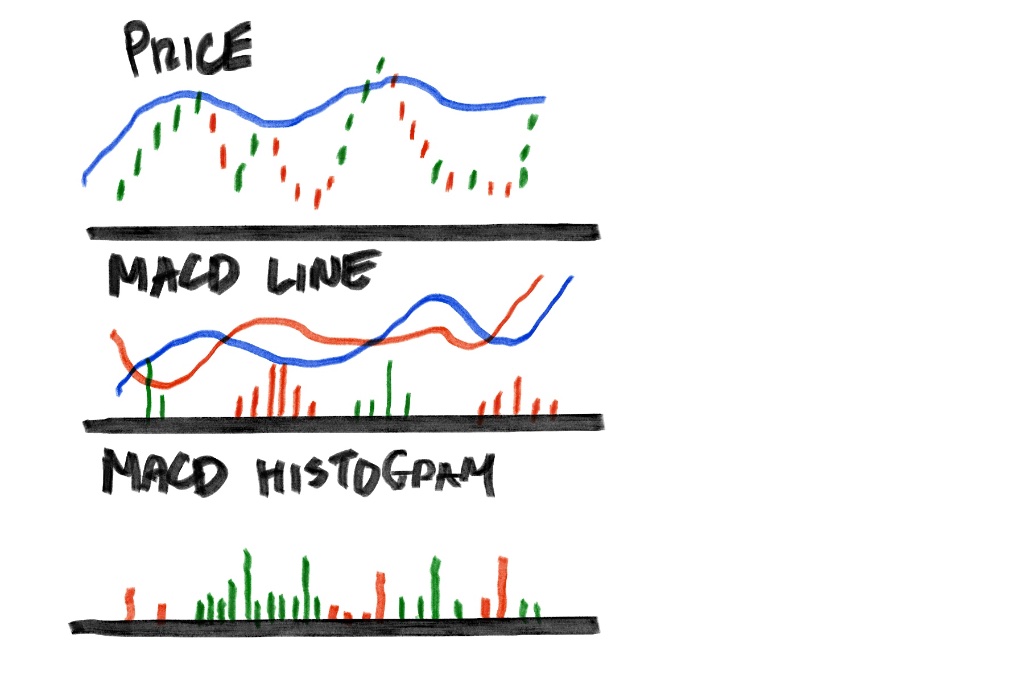
© Brian Sov. All rights reserved.
Volatility indicators measure how much an asset's price fluctuates over a given period. High volatility means larger price swings; low volatility means more stable price action. They help traders time entries during breakouts or consolidation.
Key Examples
- Bollinger Bands
Three bands: a 20-day SMA middle band with upper/lower bands set 2 standard deviations away. Price touching the outer bands may signal a reversal.
- Average True Range (ATR)
Measures the average range between high and low prices over 14 periods. Higher ATR = more volatility.
- Keltner Channels
Similar to Bollinger Bands but uses ATR for band width, offering a smoother volatility envelope.
- Chaikin Volatility
Measures the spread between high and low prices. An increase signals possible market top or bottom formation.
Illustration
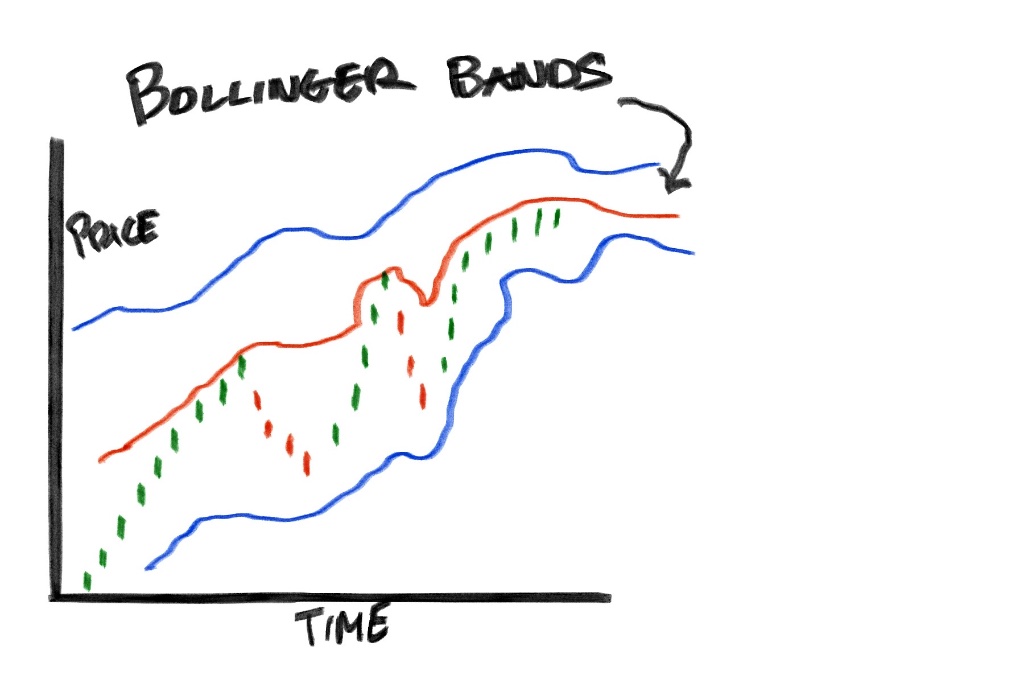
© Brian Sov. All rights reserved.
Volume indicators use trading volume data to confirm price trends or warn of potential reversals. A price move accompanied by high volume is considered more significant and reliable than one on low volume.
Key Examples
- On-Balance Volume (OBV)
Cumulative total of volume — adds volume on up days, subtracts on down days. Rising OBV confirms an uptrend.
- Volume Price Trend (VPT)
Combines price change percentage with volume. Useful for spotting divergence between price and buying/selling pressure.
- Chaikin Money Flow (CMF)
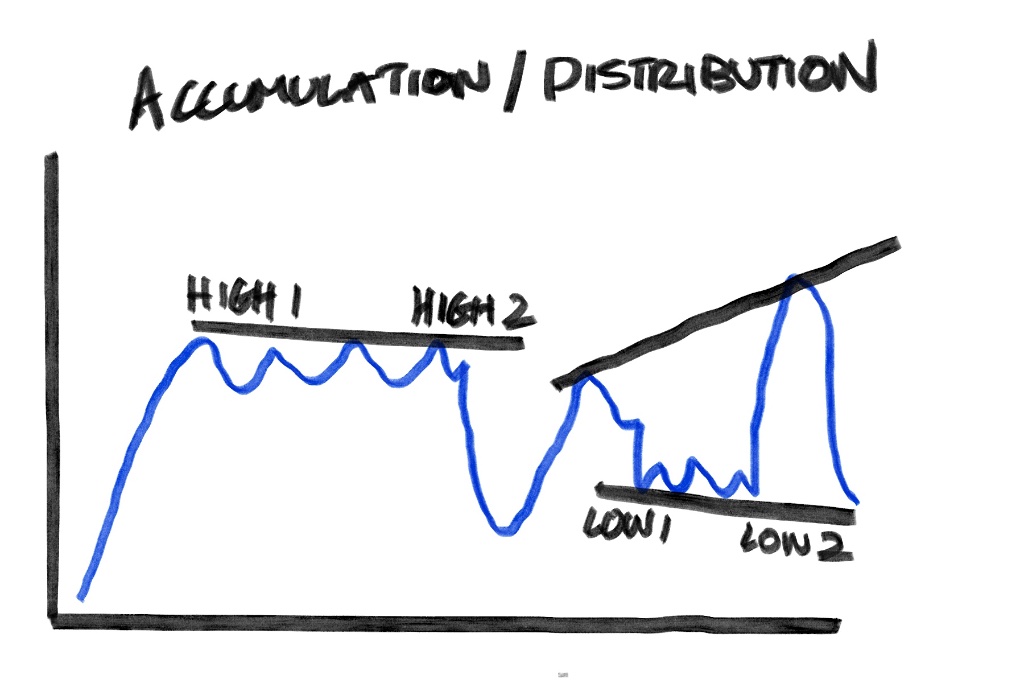
Measures buying and selling pressure over 20 periods. Positive values indicate accumulation; negative indicate distribution.
- Accumulation/Distribution Line
Tracks cumulative money flow; divergence from price action can signal upcoming reversals.
Illustration
© Brian Sov. All rights reserved.
Technical vs. Fundamental Analysis
Both approaches have merit. Many professional traders use them together for a complete market picture.
| Aspect | Technical Analysis | Fundamental Analysis |
|---|---|---|
| Based on | Price, volume & open interest data | Financial statements, earnings & economic data |
| Time Horizon | Short to medium term (minutes to months) | Long term (months to years) |
| Primary Use | Timing entries & exits, identifying trends | Assessing intrinsic value & long-term potential |
| Tools Used | Charts, oscillators, moving averages | P/E ratio, EPS, revenue growth, DCF models |
| Data Source | Market price action & trading activity | Balance sheet, income statement, cash flow |
| Best For | Active traders, swing traders, day traders | Value investors, buy-and-hold investors |
| Lag | Some indicators lag price (lagging indicators) | Data reported quarterly — significant lag |
| Subjectivity | Moderate — chart patterns can be interpreted differently | Moderate — valuation models rely on assumptions |