Top Daily Stock Volume Screener (RVOL)
NYSENASDAQData is updated live during trading hours. Live data may be delayed at various times.
Screen US-listed stocks by highest trading volume. View price, daily change, volume, P/E ratio, and market cap.
Custom curated and built for curious traders.
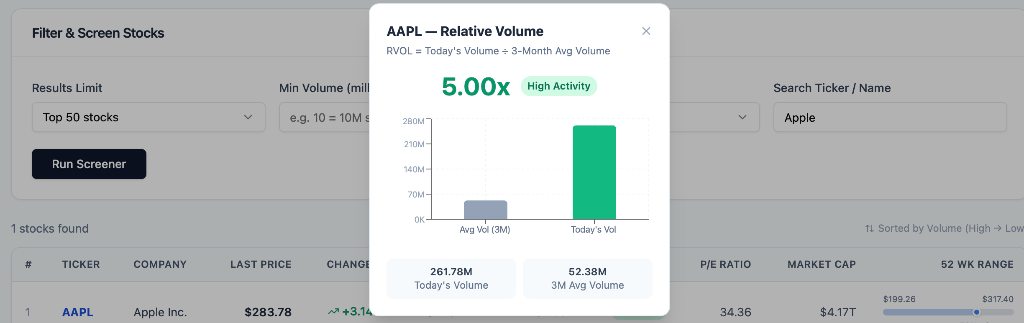
Click to enlarge
How to use RVOL
Click any RVOL badge in the screener results to see a stock's Relative Volume — today's volume compared to its 3-month average. A reading of 2x or higher signals unusually high trading activity, often tied to news, earnings, or institutional moves.
Spotting Reversals with RVOL + 52 Wk Range
A stock sitting near its 52-week low with surging RVOL may signal a reversal or accumulation phase — smart money quietly building a position. In the example below, MSFT shows a 4.76x RVOL while trading in the red and sitting at only 12% of its 52-week range — a classic setup worth watching.
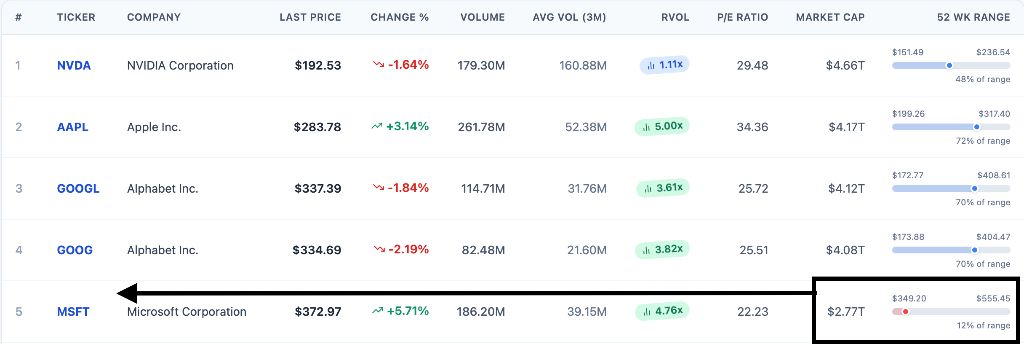
Click to enlarge
Click Run Screener to load the highest volume stocks.
Why High Volume Stocks Matter for Traders
Liquidity & Easy Entry/Exit
High-volume stocks trade millions of shares daily, meaning you can enter or exit a position quickly without significantly moving the price. Tight bid-ask spreads reduce your transaction costs, making each trade more efficient.
Price Discovery & Reliability
Heavy volume validates price moves. A breakout on high volume signals genuine institutional interest, whereas the same move on low volume is often a false signal. Volume confirmation dramatically increases the probability of a successful trade.
Reduced Slippage
Slippage — the difference between the expected price and the actual fill — shrinks dramatically in high-volume names. For options traders especially, liquidity in the underlying stock usually means tighter option spreads and better fills.
Momentum Opportunities
Stocks surging in volume often carry strong intraday momentum. Day traders and swing traders use volume spikes to identify explosive moves early, riding the wave before the crowd catches on.
Institutional Footprints
When hedge funds and institutions accumulate or distribute shares, volume spikes reveal their activity. Retail traders can use these footprints to align with — rather than fight against — the smart money.
Options Premium Efficiency
High underlying volume generally means active options chains with competitive premiums. Option sellers (cash-secured puts, covered calls, credit spreads) benefit from liquid options markets where they can get filled at favorable prices.
How to Use This Screener for Profitable Trade Setups
- 1.Run the screener daily before market open or at the open. The most active stocks of the day are often the ones with news catalysts, earnings, or sector momentum. These are your hunting grounds.
- 2.Filter by minimum volume (e.g., 10M+ shares). This eliminates thinly traded names and keeps you focused on stocks with institutional participation and tight spreads.
- 3.Cross-reference the Change % column. Stocks with high volume AND a significant positive or negative move are experiencing a catalyst. Look for stocks up 3–10% on 2x–5x average volume — these often continue in the direction of the move intraday.
- 4.Check the 52-Week Range. A stock near its 52-week high breaking out on high volume is a classic momentum setup. A stock near its 52-week low with surging volume may signal a reversal or accumulation phase.
- 5.Use P/E Ratio for context. High volume in a low-P/E stock may suggest value accumulation. High volume in a high-P/E growth stock often indicates momentum continuation — match your strategy to the stock's profile.
- 6.For option sellers: Use this list to find liquid underlying stocks for cash-secured puts or covered calls. High volume = liquid options chain = better premium pricing and easier roll management.
Financial Disclaimer
The information provided is for informational and educational purposes only and does not constitute financial advice, investment advice, or a recommendation to buy or sell any securities. All data is for illustrative purposes and should not be relied upon for investment decisions. Consult a qualified financial professional before making any financial decisions.